- Published on
P-Diagrams
- Authors
- Name
The Role of P-Diagrams in Product Development
P-diagrams (parameter diagrams) are a powerful tool that is often ignored or underutilized by product development teams. They are not a silver bullet for identifying all failure modes of a system. So, I do not intend to conclude this article by stating that P-diagrams will solve all your product design issues. However, they are a powerful tool that enables robust system design and helps systems engineers adopt a structured problem-solving approach. Based on some recent work I have done on a product, I wanted to share my experience with my network regarding how to use this tool and how you can get the most from it. I also hope to influence systems engineering leaders to consider it an essential part of their early development efforts, including requirements elicitation and system design processes.
Elements of a P-Diagram
P-diagrams assist system engineers in developing a holistic representation of a system's emergent behavior by mapping the inputs, parameters, and outputs of a system. Consequently, it naturally becomes an excellent tool for analyzing the emergent behavior of complex systems—behavior that arises from interactions among components and is often unpredictable based on the properties of individual components of a system 1. The tool also aids in other frameworks like Design for Six Sigma, which emphasizes minimizing variations through a robust design process 2. We can utilize the information generated from the P-diagrams, such as error states and noise factors, to generate failure modes and potential causes for developing the DFSS framework.
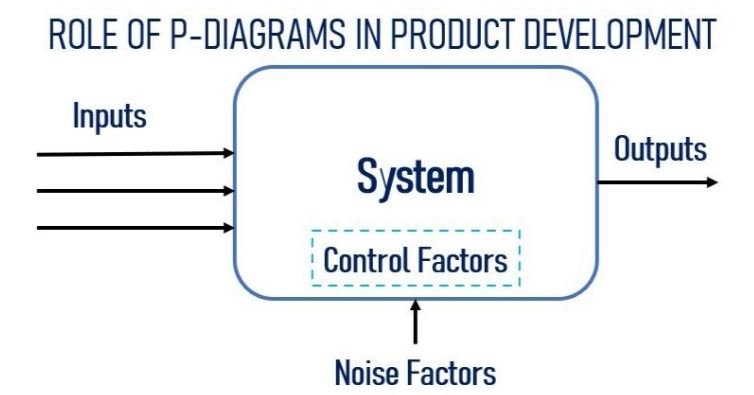
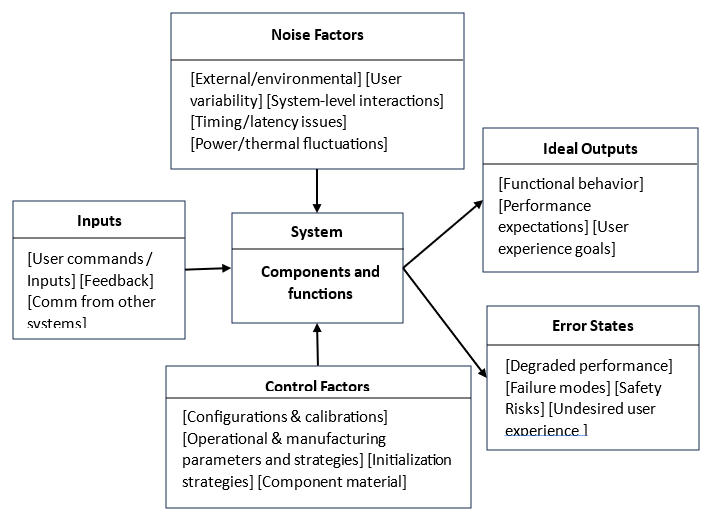
A P-diagram includes five components in addition to the system or process being considered: inputs to the system, control factors, noise factors, desired outputs, and error states or degraded system modes.
- Inputs: Inputs are typically user commands, sensor inputs, or feedback signals that impact system behavior. They can also include internal signals if they influence system performance and desired behavior.
- Noise Factors: Noise factors are generally sources of variation outside the designer's control that often trigger or exacerbate failure modes [3]. Examples include environmental conditions (temperature, humidity), wear and tear, user variability, and manufacturing tolerances.
- Control Factors: Control factors are design elements and strategies considered by designers to develop a robust system. Examples include system calibrations, component material types, initialization strategies, and control parameters used to achieve optimum system performance despite noise factors.
- Outputs: Outputs represent the expected system behaviors, such as functional performance, response times, or metrics that gauge customer experience. They are typically defined by stakeholder requirements.
- Error States: Error states refer to unintended system behaviors, including failure modes, safety risks, or poor user experiences. It is crucial to consider specific failure symptoms and their potential causes when identifying error states instead of merely negating the expected outputs.
While it is the systems design engineer’s responsibility to develop this in a product development setting, requirement engineers, component design engineers, and V&V engineers must understand these influencing factors to assist in failure mode analysis and root cause identification analysis.
Application of P-Diagrams in Product Development
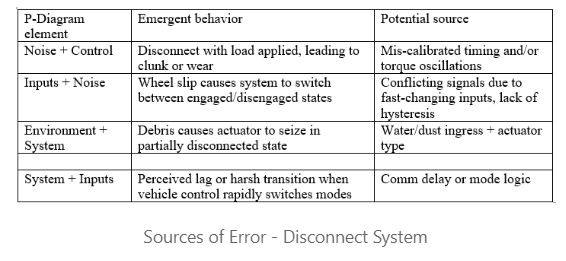
The true benefit of a P-diagram lies in its ability to guide the failure mode analysis (FMEA) and root cause investigations. When a system exhibits unexpected behavior, engineers can start from the control and noise factors to analyze plausible failure paths. This systemic approach often identifies issues that traditional failure analyses, like fishbone, may overlook, especially in complex mechatronic systems 3.
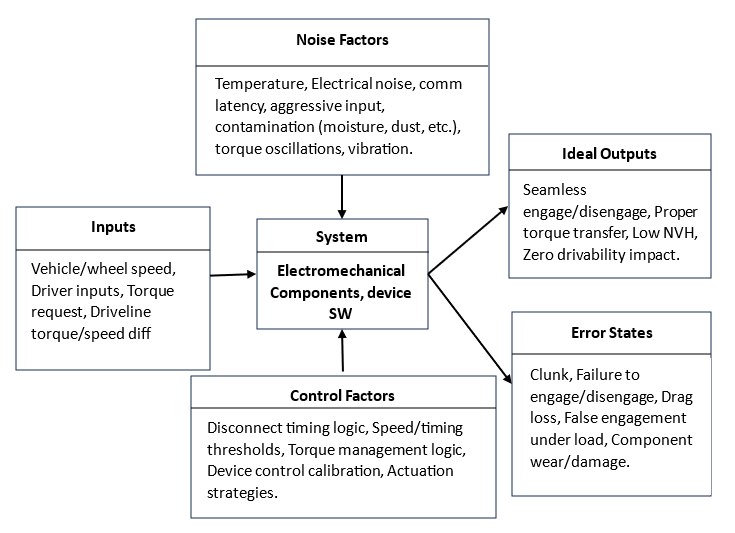
Example: Disconnect System in Drivetrain
To demonstrate the application of a P-diagram, I will consider a driveline disconnect system that enables switching between disconnected, forward propulsion, and regen modes. This driveline subsystem is a great candidate for analyzing the emergent behavior under certain driving conditions because it is a simple system, yet interactions due to the composition of the mechanical components, actuators, sensors, and control logic with other driveline subsystems and vehicle control units. If you are interested in learning about the disconnect system technology, please refer to the article in the references section 4.
P-Diagram Elements
When transitioning between modes, a vehicle control system relies on input from an automatic state selection algorithm based on the vehicle controls. So, the inputs and control parameters vary based on the mode selection approach. However, to simplify the p-diagram approach, we will ignore the failure modes from the vehicle controls that might impact the mode-switching patterns.

Each error state may stem from different causes and could impact the system’s performance and safety. By mapping this system into a P-diagram, development teams can develop failure modes and potential emergent behavior from system interactions. These insights can guide teams in effective design verification & validation, and robustness testing.
By mapping this system into a P-diagram, development teams can develop failure modes and potential emergent behavior from system interactions. These insights can guide an effective design validation, verification planning, and robustness testing.
Conclusion
P-diagrams are a practical tool that enables a robust design process and effective failure mode identification and root cause analysis. The benefits are higher when this tool is used early in the product development process, particularly during requirements definition and functional decomposition. This tool will not replace the detailed design tools your organization uses or the design effort by the development teams. However, their value lies in enabling the engineering teams to visualize and proactively address the variability inherent in complex systems.
Footnotes
Haskins, C. INCOSE Systems Engineering Handbook. Wiley, 2006. ↩
Quality-One. Introduction to Design for Six Sigma (DFSS). https://quality-one.com/dfss/. ↩
Heinold, L., Barkanyi, A., Abonyi, J. (2021, May). Test Plan for the Verification of the Robustness of Sensors and Automotive Electronic Products Using Scenario-Based Noise Deployment (SND). DOI:10.3390/s21103359 ↩
Jennings, J. (2024, February). Unlocking the Key to Seamless EV Driveline Disconnects. https://cti-symposium.world/unlocking-the-key-to-seamless-ev-driveline-disconnects-2/ ↩